It’s election time in Sweden and my good friend and colleague, Caroline Tigersjö, made a really cool thing with Civil3D – she imported the voting district coordinates of the Swedish town Enköping and mapped them to a Google Earth map. Of course it made me curious and challenged me to do the same using Dynamo!
This led me to a small excursion into reading JSON files into Dynamo and at the end I couldn’t stop myself from connecting Dynamo with AutoCAD to create a complete DWG with all the voting areas as polylines. Even though there’s no Dynamo in AutoCAD (yet)!
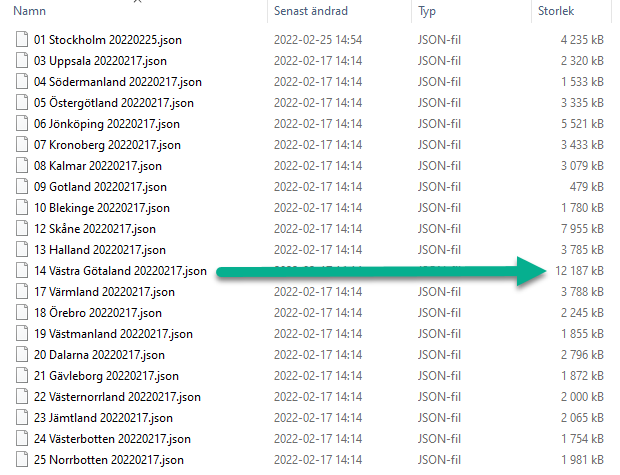
My first step was to download the offical open data from the election authority, Valmyndigheten, which turned out to be 21 .JSON-files in various sizes. Wonderful little summer destination Gotland was of course the smallest file and strangely enough the area around Göteborg the largest one by far. Strange, I would assumed Stockholm would have been the largest one. Slightly suspicious even.

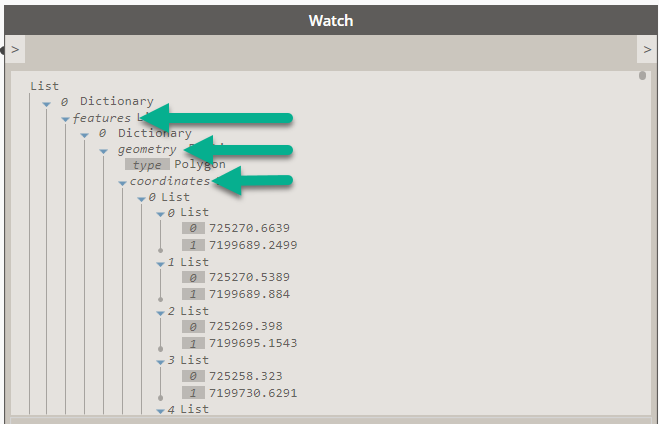
This gave me the general structure of the JSON – the coordinates were in the Swedish coordinate system Sweref 99TM and in meters. They were located under “features“, then “geometry” and finally “coordinates“.
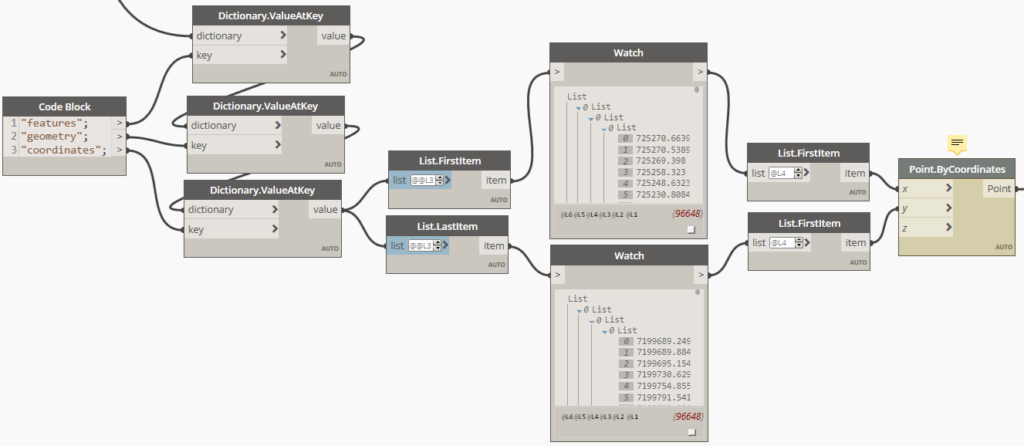
So the next part of the script simply went down the structure – asking for the keys one after each other. There’s probably a much nicer way of doing this, but it works. The really tricky thing was getting the correct list structure for the Point.ByCoordinates command, here I had to play around quite some time with different levels until I got it just right. One key (of several) was keeping the incoming list structure and not letting FirstItem and LastItem ruin the fun.
Now I had 1.8 million points in Dynamo.
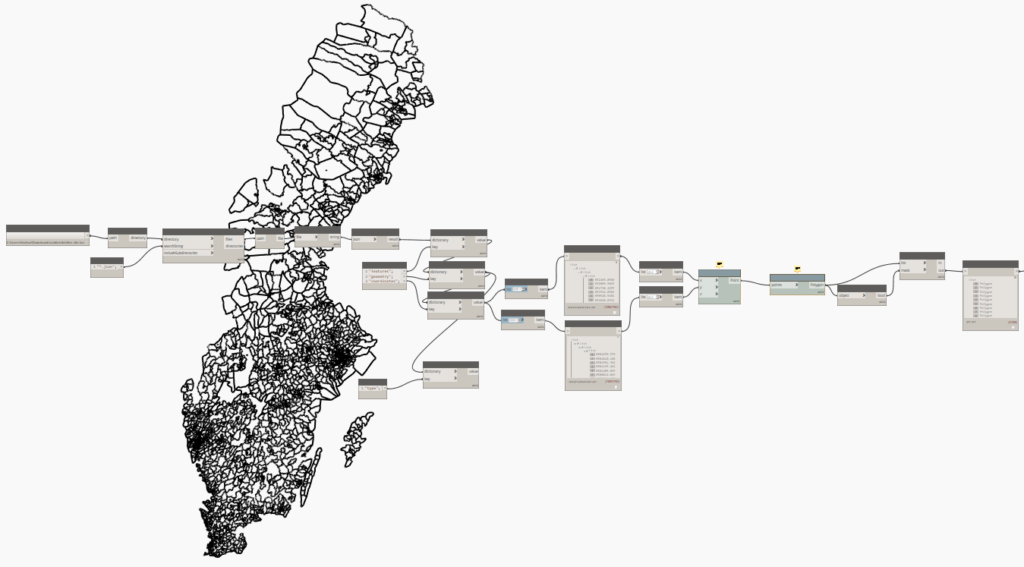
I then made polygons from the points (luckily they were in order!) and with a bit of cleaning I had them – 6634 polygons and more or less all of Sweden in Dynamo! Some areas were missing due to broken/multi-shape polygons and Dynamo Sandbox was now using 17GB of RAM…
But I felt that I wasn’t done. I needed to do more – after all, my colleague managed to get her areas into Civil3D. I knew this would never work in Revit (or will it? hmm) so I settled for AutoCAD. There’s no Dynamo in clean AutoCAD, just in Civil3D so I had to drive AutoCAD in a slightly different way.
Using a Python node you can actually access a running AutoCAD in the background – you need to get the “interopservice“, then the current document and a good piece of googling to find the correct AutoCAD API-commands. By using “dir(AcDoc.Modelspace)” I managed to find the AddPolyLine function – and that one apparently required a float array of x, y and z according to the interwebs.
Some simple for loops to iterate first the voting district and then each point – get the coordinates and fill a list in a way that would be suitable for converting into the float array which the polyline function required.
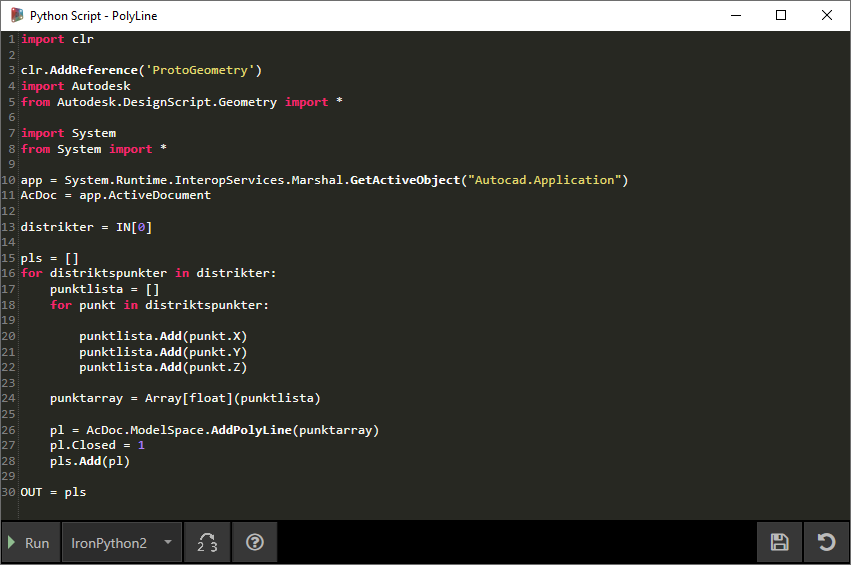
And to my amazement this actually worked (after quite a few tries and out-of-memory crashes)! I ran the script in Dynamo – it read the JSONs, created Dynamo geometry and then carried on to create 5788 polylines in AutoCAD! Some districts were apparently lost along the way but it’s a big country and I’m sure nobody will notice.
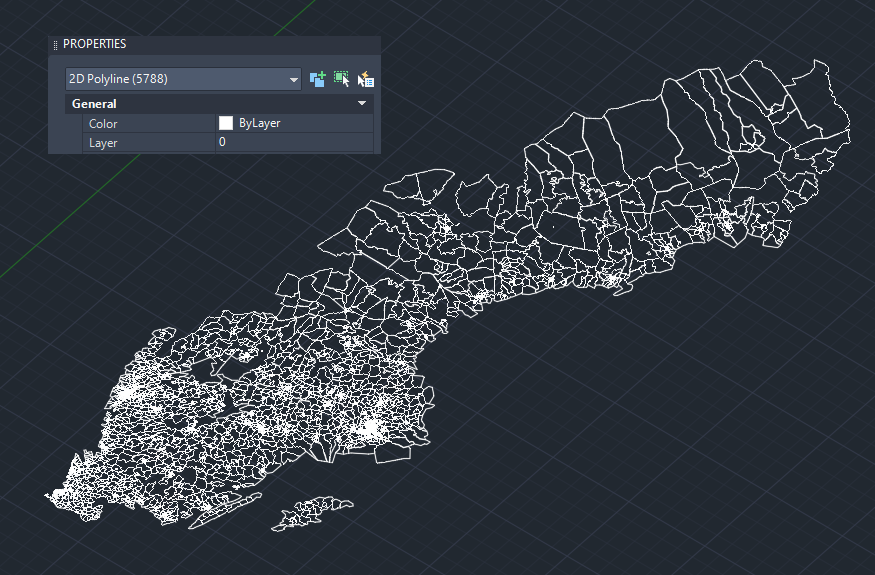
I now have all of Sweden in one DWG, with coordinates! Pretty cool! 🙂
Next step is creating layers as well – the names of the 5788 areas are also in the JSON files…. Maybe fixing those multi-polygons. Getting a bit more RAM from IT and extruding the areas perhaps?
As a final note I did try to run with CPython instead of ancient IronPython2 and couldn’t get it to work, not quite sure why, I wasn’t able to access the AutoCAD document or the interop…. And just about then my train from Göteborg finally arrived Stockholm and I had to stop.

